Ready to make an impact on your employees, customers, and recipients? Click the button to register your organization. Keep your business EIN handy.
Help Employer Customers Cut Costs
Improve completion rates with incentivized programs

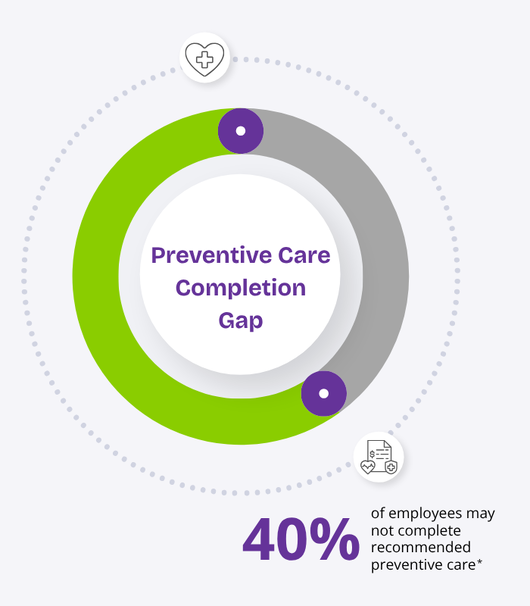
Low completion rates cost money.
Most employer groups already have preventive care programs in place: annual visits, screenings, biometrics. Completion remains low, with nearly 40% of employees not completing recommended preventive care activities.
And when those actions don’t happen, employers don’t see the cost savings they expect.
The issue isn’t access—it’s getting employees to actually complete the actions.
What’s in the way of your success:
- Incentives aren’t tied to specific actions like annual visits or screenings
- Employers either rely on penalties (premium differentials) or rewards offered inconsistently
- Incentives are administered manually and hard to scale
- There’s no visibility info or tracking for: who completed care → who gets rewarded → what outcomes improved
%20(250%20x%20250%20px)%20(1).png)
Why incentives don’t scale
Most employer programs don’t fail because they lack solutions. They fail because key actions—like annual visits, screenings, and biometrics—aren’t completed at scale.
Without completion, gaps in care remain open, preventive utilization stalls, and healthcare costs spiral out of control. When outcomes aren't measurable, conversations with employers become difficult-especially at renewal, where cost justification with solid reporting is critical.
Most incentive models add friction. Premium differentials create resistance, rewards are manually tracked and inconsistently delivered, and there’s no clear line from action to outcome to reporting.
If you improve completion, you improve outcomes and employer value.

A simpler way to drive completion
Fix the incentive model—not the program. Instead of rewarding intent, tie incentives directly to verified health actions like annual visits, screenings, and biometric completion.
Incentives are triggered only when actions are completed, aligning every reward to a measurable outcome. This reduces wasted spend, simplifies execution and reporting, and creates a more consistent experience across employer groups.
Our solution gives TPAs a simple, repeatable way to deploy incentives across employer groups without manual tracking or inconsistent delivery.
This shifts incentives from a perk to a performance and cost-control mechanism.
Incentives that drive measurable completion

Why most incentive programs don’t deliver results
Most incentive programs are designed around distribution, not outcomes. Rewards are issued, but there’s limited connection between the action taken and the result achieved.
In practice, this creates program inefficiencies. Incentives are often managed manually, tied loosely to behaviors, and difficult to track across employer groups. At the same time, many organizations rely on premium differentials, which can create resistance and poorer results instead of participation.
The result is predictable: rewards are delivered, but completion rates remain low and outcomes are hard to measure.
We take a different approach. Incentives are structured around verified actions—like annual visits, screenings, and biometric completion—so every reward is tied directly to a measurable outcome.
This creates a clearer path from action to completion to reporting—making programs easier to manage and justify, with clear ROI.
See how incentives drive completion
Why premium differentials fall short
Many employer programs rely on premium differentials—adjusting employee contributions based on whether preventive actions are completed.
In theory, this should drive participation. In practice, it often acts as a disincentive for the employee. The incentive is delayed, difficult to connect to the behavior, and with the differential impacting the employee as a penalty, program participation goes down and expenses go up.
For self-insured employers, this creates a gap between program and desired outcome. Preventive care is financially critical, but the incentive structure doesn’t consistently drive completion or measurable outcomes.
As a result, many organizations are shifting toward simpler, more immediate incentives tied directly to verified actions—making it easier to drive participation and easier to show value.
Let's discuss a better approach-1.png)
Employer clients don’t just want engagement—they want results they can measure and defend.
With the right incentive structure, you can clearly connect actions to outcomes and show the impact of preventive care programs in real terms.
This includes visibility into completion rates, cost per completed visit or screening, and how utilization changes over time.
Instead of guessing what’s working, you can demonstrate where behavior is improving and how incentive spend is contributing to measurable results.
This turns incentives into a reportable performance driver—making employer conversations easier at renewal and strengthening your value as a partner.
Use cases that drive measurable completion
Focus incentives on high-impact actions where completion directly improves outcomes, reduces cost risk, and strengthens employer value.

Preventive Screenings

Annual Wellness Visits
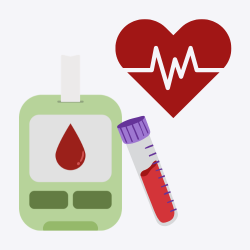
Biometric Screenings & Bloodwork
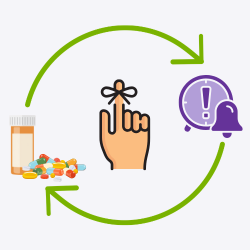
Medication Adherence Programs

HRA Completion
Start small. Prove what works.
The fastest way to validate impact across employer groups:
One program
One employer group
One defined action
One measurable outcome
Measure completion lift, cost per completed action, and program impact within 60–90 days.
No upfront complexity. No wasted spend. Just a focused test tied directly to real outcomes.
Run a pilot program today!
Why the Engage2Reward Platform
We don’t just distribute incentives. We help you structure them for measurable performance:
- Tie rewards to verified member actions
- Enable fund-on-claim models (only pay for completion)
- Configure programs by employer group or use case
- Support portfolio-wide deployment without added admin burden
- Provide reporting built for employer conversations and renewals
This is about control, accountability, and measurable outcomes—at scale.
Register Your Business For Free